How to interpret a retention graph

A short while ago I did a retention analysis for a client of mine and it struck me how hard it is to:
a) truly understand retention graphs if you haven't interpreted one in a while
b) explain the result to others
Some questions popped up in my colleague John's head when I presented him with a graph like the one above. Probably because I did such as lousy job explaining what we where looking at:) Lets go through his very reasonable and adequate questions (answers below each question) that helped me give a better explanation which in turn helped John himself to fully understand what the graph actually said:
1. Should I compare the retention rate in Week 2 with Week 1 or should I compare it to Week 0? How are the retention rates related to each other week by week?
- -> You should interpret all weekly retention rates in relation to Week 0, which is the benchmark measurement
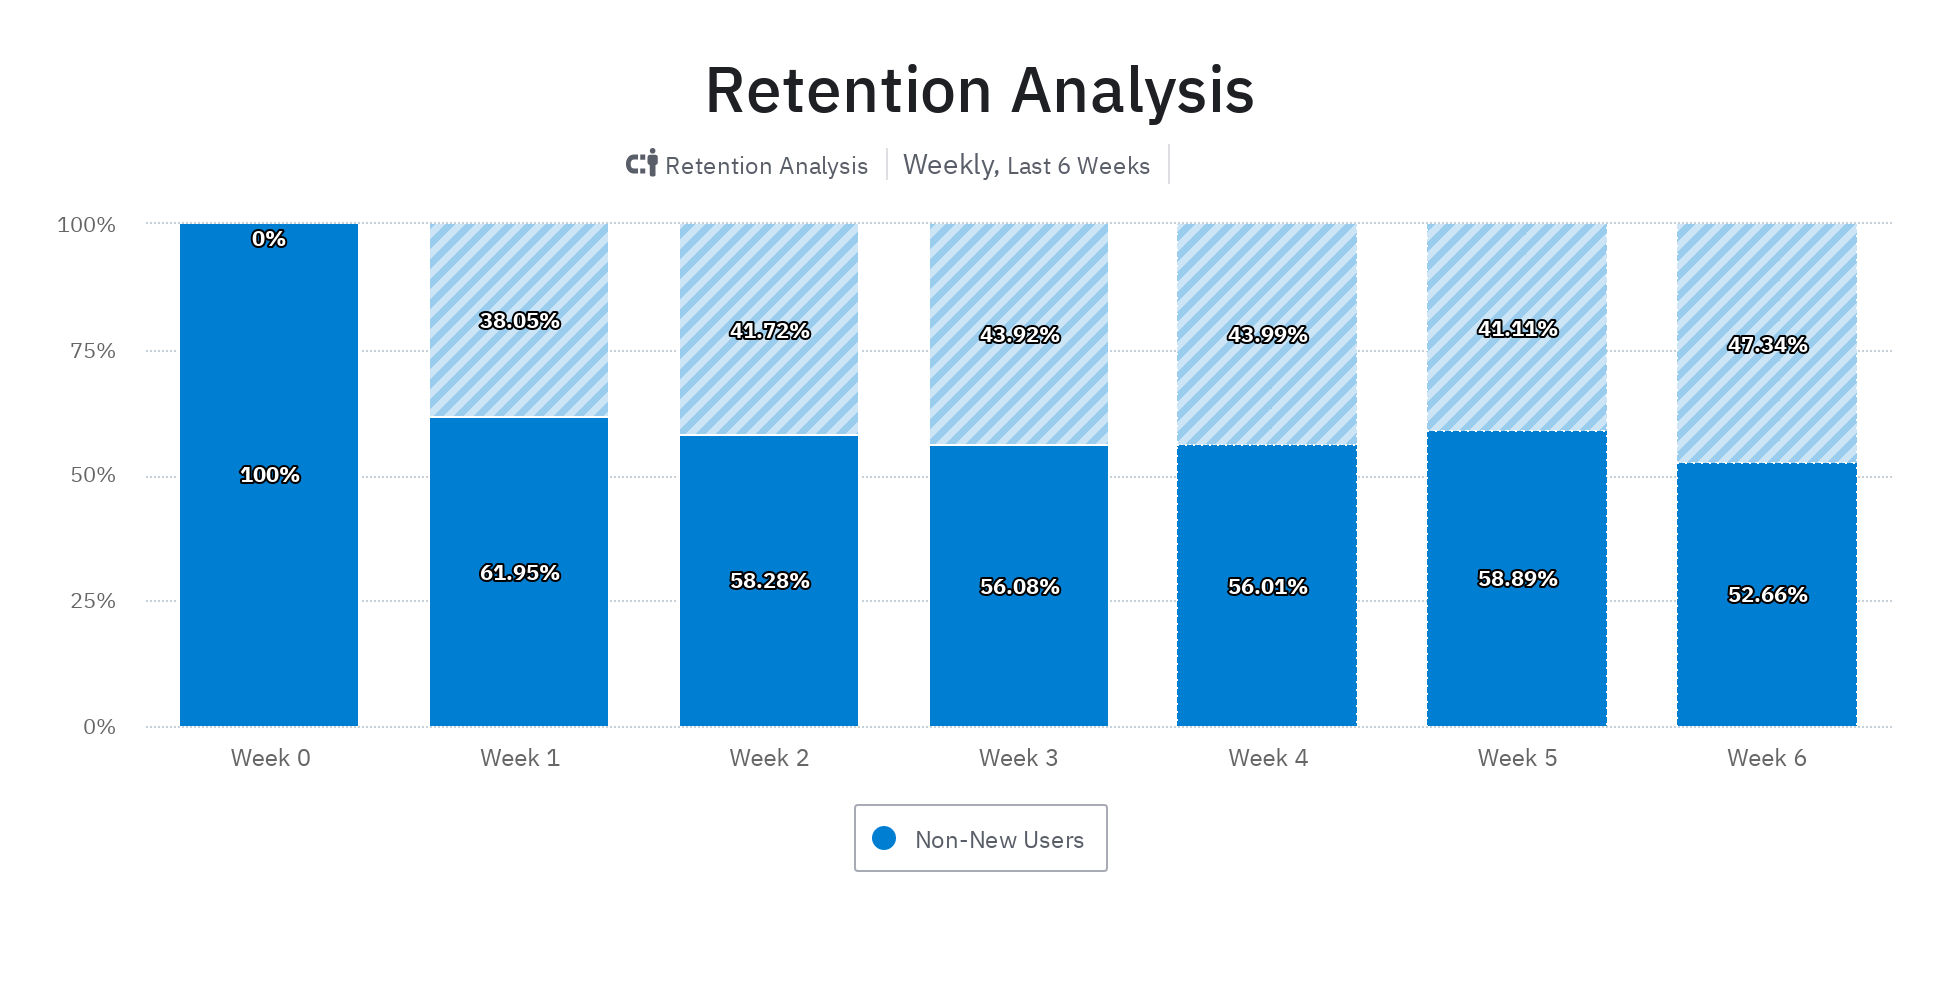
1.1 Am I right if the graph tells that 61,95% of the users that were active Week 0 also were active during Week 1?
- -> Yes, this is simple put a correct interpretation. 61,95% of the users that were active Week 0 and has had the chance of being active in Week 1, up to the day of the analysis, is the longer answer.
1.2. Does the retention of 58,28% in Week 2 mean that 94% (58,28% / 61,95%) of the users that were active in Week 2 also were active in Week 3?
- -> No, it does not. Look at the retention rates of Week 4 and Week 5, where the ratio increases between the two weeks. What the retention rate of e.g. week 2 says is that 58,28% of the users that were active in Week 0 were active during Week 2. 61,95% of users that where active in Week 0 where active in Week 3 and so on. Always look at all retention rates in relation to Week 0!
In the graph above, the critical event is triggered by active users during Week 0. All users that are taken into the account (the user selection) for the retention analysis trigger this event during their first week of usage, hence 100% in Week 0. What the retention graph then visualizes is the proportion of users who are active in the product during a specific Week N (Week 1, Week 2... etc) after first use.
Want to know more about retention analysis such as the difference between N-day/week/month retention and Unbound retention as well as when to use which? Or how the retention rates in the graph above are calculated, through weighted averages, to get an ever deeper understanding of what the graph actually says? Sign up for weekly updates on this and other subjects that will help you excel in your digital value creation!